There is a question Nigerian economists are professionally trained not to ask in plain language: why are Nigerians, in a country with this much oil, this much land, this much labour and this large a market, not wealthy? Not in the per-capita-GDP sense (the Boom That Never Came Back answers that). The narrower household question: why does the median Nigerian, after thirty years of work, own almost nothing?
The answer is not a moral one (Nigerians do not save less than Indians or Bangladeshis — household saving rates have hovered around 18–22% of disposable income for decades). It is a structural one. Household balance sheets in Nigeria are drained, every decade, by seven pipes that are always open — and the faucet feeding the tank is barely on in the first place. Each pipe is documented, each is the subject of a separate story on this site, and each, on its own, would be an inconvenience. Together they are the reason a generation that worked through the oil boom ended it poorer than it started.
Pipe 0 — The wage share: the faucet that was never turned on. Before any pipe drains the tank, the tank has to fill. In Nigeria it barely does. The labour share of GDP — the portion of national income paid out as wages and salaries — has sat between 25% and 30% for most of the post-SAP period, against a global average closer to 52% and OECD averages above 58% (ILO, *Global Wage Report 2022–23*). The federal minimum wage, set at ₦70,000/month in 2024, is worth roughly US$42 at the official rate — lower in real dollar terms than the ₦125/month minimum wage of 1981 (about US$190). NBS Labour Force surveys put median monthly earnings for employed Nigerians at ₦40,000–₦50,000 (≈US$25–30) in 2023. A household earning the median wage, saving the same 20% of income that an Indian or Bangladeshi household saves, is saving US$5–6 a month — a sum no insurance product, mortgage instrument or pension plan in the formal economy is priced to absorb. Pipes 1 through 7 explain where Nigerian savings go; Pipe 0 explains why there were so few savings to begin with. The story of Nigerian wages — from the 1945 General Strike through the Udoji awards to the perpetual minimum-wage standoffs of the Fourth Republic — is the upstream half of this story.
Pipe 1 — Bank failures, uninsured deposits, and the 2008 stock-market crash. Between 1994 and 1998 alone the failure of 36 indigenous banks (see Act V) wiped out an estimated ₦69 billion of household deposits in real terms — at a time when the NDIC insurance ceiling was ₦50,000 per depositor and most middle-class accounts exceeded it ten times over. The 2009 Sanusi audit and AMCON (Act VII) was a sovereign rescue of the institutions, not the depositors who had bought their shares with retirement savings.
The same period delivered the single largest one-shot destruction of Nigerian household wealth on record: the 2008 NSE crash. Market capitalisation collapsed from a March 2008 peak of ₦13.5 trillion to under ₦4.5 trillion by January 2009 — roughly ₦9 trillion of equity wealth, the bulk of it owned by retail investors who had been pushed into bank IPOs and margin loans during the 2004–2007 recapitalisation frenzy. The wipeout was not a passive market correction: it was the unwinding of margin loans that bank CEOs had extended to inflate their own share prices. By the time AMCON absorbed ~₦4 trillion of those bad loans, the institutions had been recapitalised — but the individual shareholder who had borrowed against his salary to buy bank shares at ₦40 found them at ₦4 and the loan still outstanding. The NSE All-Share Index did not regain its 2008 peak, in nominal naira, until 2024 — and in dollar terms remains worth a fraction of what it was sixteen years earlier. The deeper structural story — why retail investors have so little equity wealth to lose in the first place — is told in The Nigerian Exchange — A Market Without Floats.
Pipe 2 — Currency devaluation as a permanent wealth tax. The naira has lost roughly 99.97% of its value against the dollar between 1980 and 2025 — from ₦0.55/US$ in 1980 to over ₦1,650/US$ in 2025. Every naira saved in 1980 was a vote of confidence in the federal government's monetary management; that vote has been progressively confiscated. A household that saved ₦100,000 in a bank deposit account in 1980 (about US$180,000) and never touched it has US$60 today. The middle-class generation that saved diligently was punished for trusting the currency they were paid in.
Pipe 3 — Negative real interest rates. For most years since 1986, headline inflation in Nigeria has run above the savings deposit rate. A ₦1m savings account earning 8% in a year when headline inflation prints 24% (2024) loses ₦160,000 of purchasing power. Compounded across a working life, the cost of being a depositor in a chronically inflationary economy is the largest single drain on Nigerian household wealth. South African and Kenyan households, with positive real rates for most of the period, did not face this.
Pipe 4 — No mortgages, no home equity compounding. Of an adult population over 130 million, Nigeria has roughly 40,000 active mortgages (see Credit Vacuum). The single largest wealth-building mechanism for every middle class on earth — buying a home with a 25-year mortgage, paying it off, retiring with the asset — does not exist in Nigeria at scale. 85% of urban Nigerians rent. The landlord cannot get a mortgage either, so the rent is collected one year in advance, in cash, which is a different drain on the same balance sheet.
Pipe 5 — Pension default and the pre-2004 generation. Before the Pension Reform Act 2004 created the contributory PFA system, federal and state pensions were Defined Benefit schemes paid out of current revenue. For most of the 1990s and early 2000s, most state pensioners were not paid for months or years at a time; the 'pensioners' verification queue' at the Treasury became a recurring news image. An estimated ₦2 trillion in unpaid pension liabilities had accumulated by 2003. The Obasanjo reform fixed the system going forward but did almost nothing for the cohort that had already retired. A generation that had worked 35 years for the federal civil service entered retirement with neither pension nor savings (see Pipe 2 for what the savings became).
Pipe 6 — Ponzi cycles, decade after decade. Umana Umana (1980s, Cross River) — Nospetco (2007, Lagos) — MMM Nigeria (2016, an estimated 3 million participants, ~₦18bn lost in the December collapse) — Loom and Givers Forum (2019) — CBEX (2024–2025, an estimated ₦1.3 trillion in deposits frozen across multiple platforms). Each cycle is treated by regulators as a new fraud rather than as the recurring symptom of the same structural cause: a population with savings but no access to instruments that pay positive real returns (Pipe 3) and no recourse when banks fail (Pipe 1), reaching for the only product on offer that promises a return faster than inflation. Each cycle transfers tens of billions of naira of household savings to a small group of promoters and is then forgotten in time for the next.
Pipe 7 — Insurance that does not insure. The popular explanation for low insurance penetration in Nigeria is cultural: Nigerians prefer 'the blood of Jesus to insurance,' as the industry joke goes. The numbers are cultural too, but not in the way the joke implies. The Nigerian insurance market has been dominated by two state-owned giants, NICON and Niger Insurance, that were so badly managed after privatisation that they could not pay their own policyholders. NICON was sold to Jimoh Ibrahim's Global Fleet Group in 2005; by 2016 it had failed its recapitalisation, by 2020 its licence was under suspension, and by 2022 NAICOM formally cancelled it. Niger Insurance went into runoff in 2022, effectively frozen, with life-policy and annuity claims unpaid. The 2007 recapitalisation raised minimum capital from ₦2 billion to ₦5 billion; the 2020–2021 recapitalisation, meant to rescue the sector, was repeatedly extended and then quietly diluted. The result: penetration is under 0.3% of GDP — lower than Kenya (2.7%), South Africa (11.5%) and Ghana (1.0%). A household that did the responsible thing and bought a life policy or a motor cover often discovered the contract was unenforceable when the event happened. The same households then learned the rational lesson: do not trust insurance. It is not that Nigerians rejected risk management; it is that the formal insurance industry failed to sell them a product that actually paid out.
The cumulative result. No reliable national wealth survey has been done — NBS does not publish a household wealth distribution — but the Afrobarometer 2022 round found that 74% of Nigerian adults reported having 'no savings of any kind' and 88% had no insurance product (life, health or property). Knight Frank's 2023 Wealth Report identified roughly 9,800 dollar-millionaires in Nigeria, against South Africa's 37,500 and Kenya's 7,200 — a country of 230 million with a millionaire population smaller than Kenya's, which has 55 million. The Nigerian high-net-worth class exists; the Nigerian middle class, in the asset sense the term has anywhere else, mostly does not.
Fixing one pipe does not drain less water. The 2004 pension reform did not stop the 2016 MMM collapse. The 2009 AMCON rescue did not stop the 2023 naira devaluation. The 2024 bank recapitalisation does not put a mortgage in any household's hands. As long as the federal government remains the highest-yielding, lowest-risk borrower in its own economy — paying 22% on a Treasury Bill that no SME, no homeowner and no auto-buyer can compete with — the credit vacuum holds, Pipes 3 and 4 stay open, and the household balance sheet stays empty. Nigerians are not poor because they do not work. They are poor because every instrument the formal economy hands them is designed, somewhere along the line, to transfer their savings elsewhere.
Figure 1
GDP per capita, 2024: Nigeria vs peer economies (US$, nominal)
Independence-era peers — Malaysia, Indonesia, even Egypt — have left Nigeria a decade or more behind on the simplest measure of prosperity.
The money itself
Archival illustrations commissioned for this archive — format, palette and motif of each issue, not a photograph or facsimile.
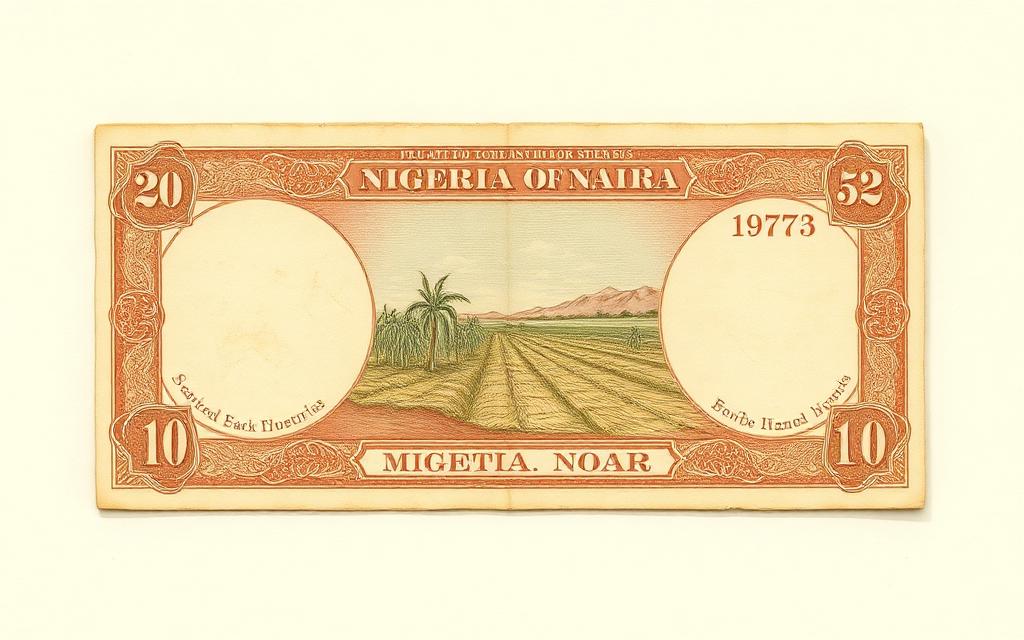
1 January 1973
The first naira
50k, ₦1, ₦5, ₦10 — decimal, agricultural motifs, and no Queen's head. Named by Awolowo, from 'Nigeria'.
What it bought
₦1 in 1973 bought roughly 16 litres of petrol, or twenty loaves of bread.
Worth today
₦1 of 1973 ≈ ₦7,010 in 2026 money.
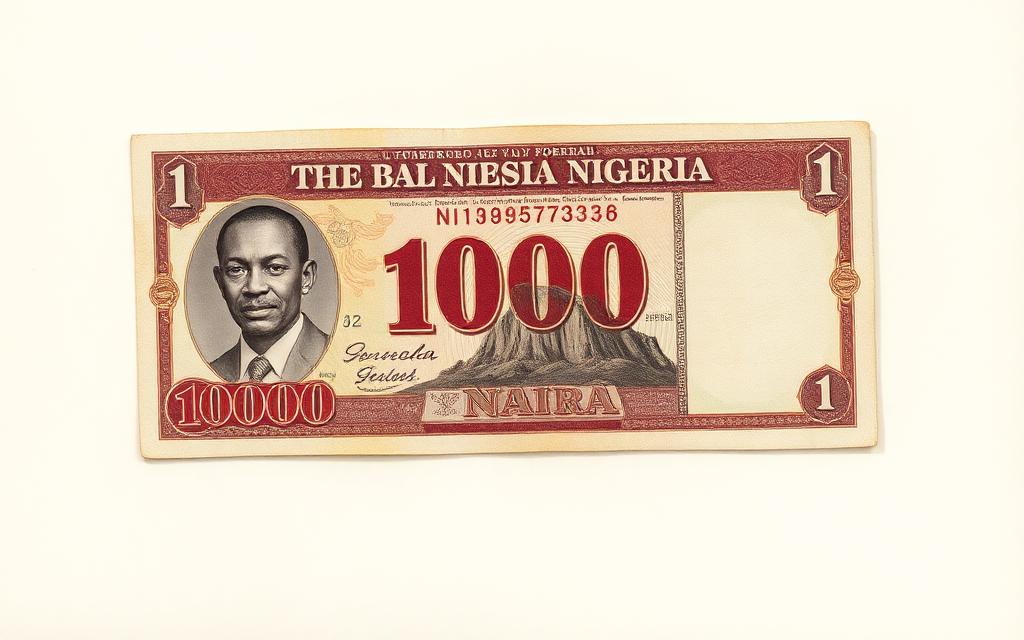
12 October 2005
₦1,000
Aliyu Mai-Bornu and Clement Isong — the first two Nigerian Governors of the Central Bank — on the obverse.
What it bought
₦1,000 in 2005 filled a car's tank with 15 litres to spare.
Worth today
₦1,000 of 2005 ≈ ₦15,800 in 2026 money. It remains the largest note in circulation.